Follow the source
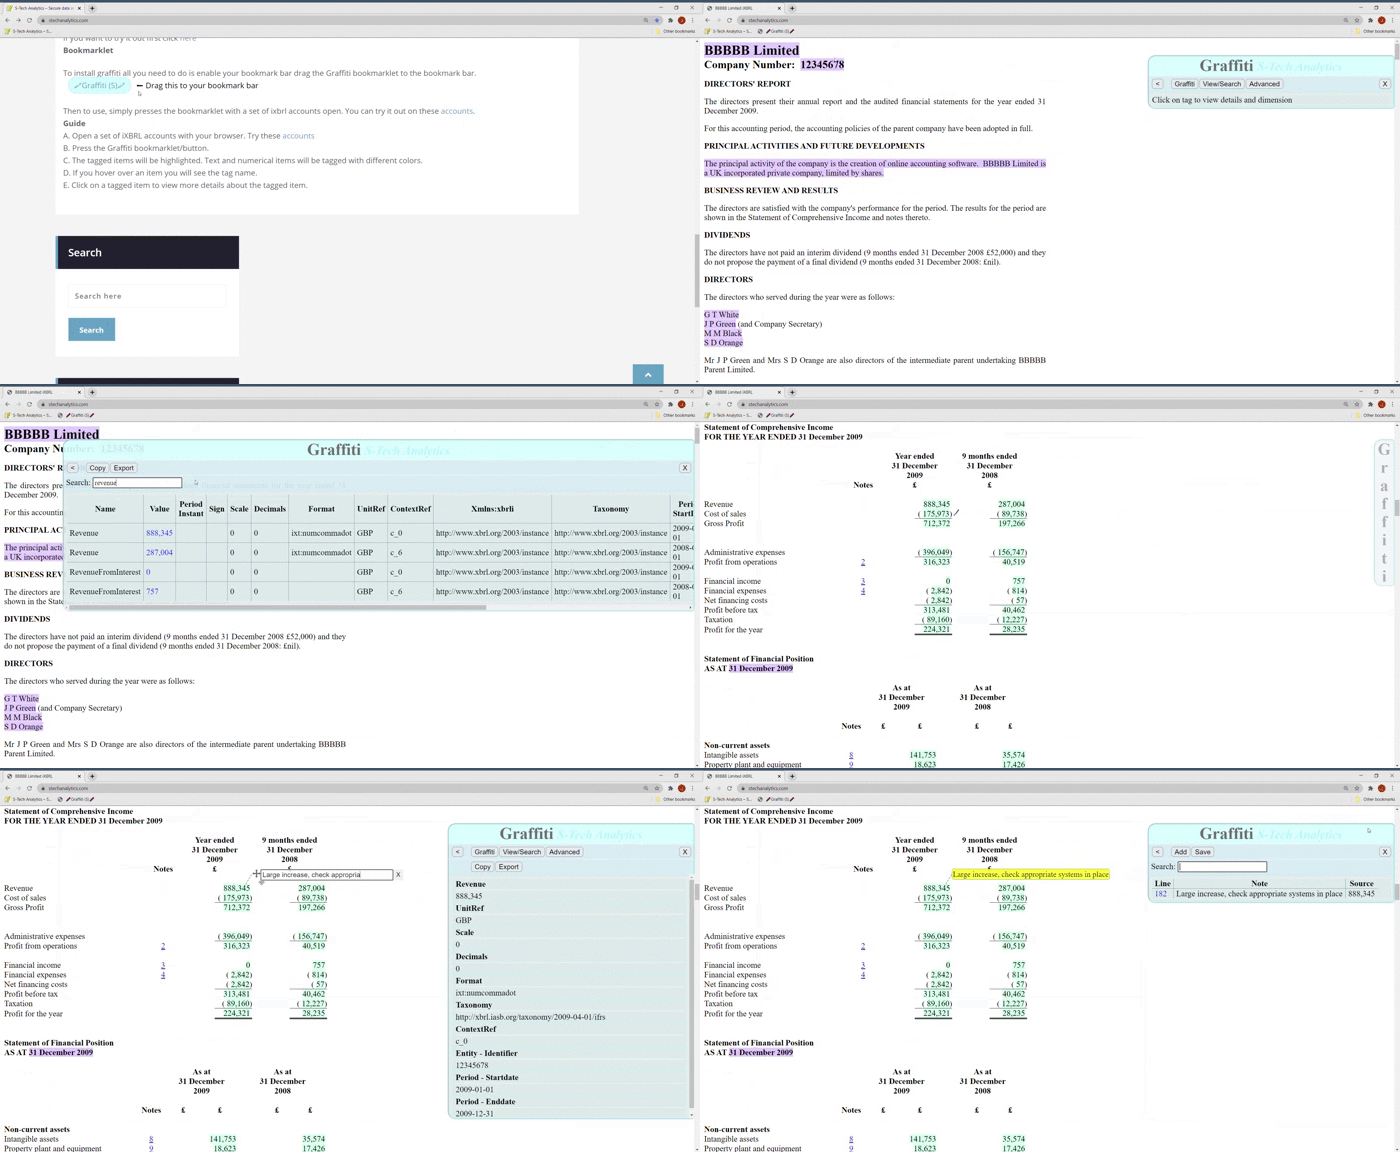
Open the Contents view, select a highlighted fact and inspect its value, period, unit, dimensions and taxonomy detail.
Live demo
Open a real Companies House filing with Graffiti already running. Explore the accounts, inspect the facts and move from the visible page to structured data.
The public demo shows the interactive viewer. Create your own shortcut for 30 days of limited Demo access to AI and Companies House analysis; Premium-only Full text and live web search are not included.
What to explore
The viewer is the starting point. A personal Graffiti shortcut adds the wider analysis workflow to filings you choose.
Open the Contents view, select a highlighted fact and inspect its value, period, unit, dimensions and taxonomy detail.
Search and filter tagged facts and recovered untagged figures, run validation checks and export to CSV, XLSX or xBRL-JSON.
With your own shortcut, ask grounded AI questions and explore Companies House trends, ratios, people, ownership and comparisons.