Ask and understand
Use plain English to explore performance, movements, risks and narrative disclosures.
- Answers grounded in the open filing
- Full-text questions across notes and policies
- Follow-up questions and source context
Analyse iXBRL accounts
GrAffitI
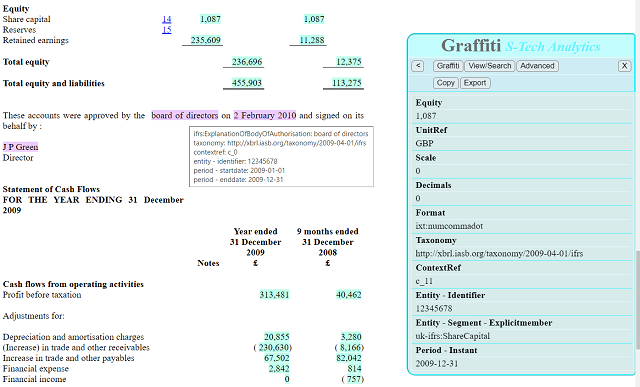
View and navigate all the data in iXBRL documents, with integrated Companies House functionality to explore up to 10 years of trends and ratios, plus AI analysis that uses relevant external sources.
Runs in your browser. No desktop software.
More than a viewer
Graffiti brings the accounts, Companies House data and AI together in one browser-based analysis tool. Start with the source and stay connected to it.
Use plain English to explore performance, movements, risks and narrative disclosures.
Move from the visible accounts to the data underneath, then back to the exact source.
Put the current filing in context with live Companies House information.
Turn the filing into review-ready data without losing the evidence trail.
How it works
Use the live demo immediately, or add the Graffiti shortcut to your browser for accounts you work with every day.
Load a Companies House filing, a direct URL, a local iXBRL file or an ESEF report package.
The filing becomes searchable and its facts, sections and company context become available.
Ask, compare, validate, annotate and export while keeping the original accounts alongside the answer.
Built around the evidence
A quick answer is useful. A quick answer you can verify is better.
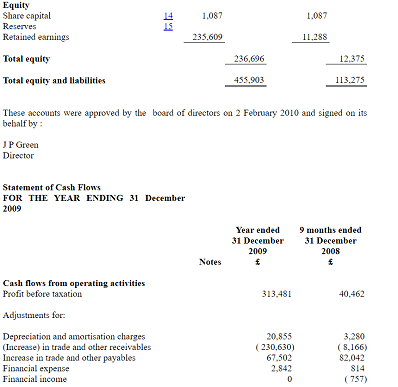
Graffiti works on the filing itself. Click a highlighted value to see what it means, where it came from and which period it covers. AI helps with the first pass; the source remains visible for professional judgement.
Browser-first by design
Local files and ESEF ZIP packages are parsed in your browser. Encrypted notes stay in browser storage. AI and Companies House features use authenticated network requests.
See it working
Explore a hosted filing now, or add Graffiti to analyse your own iXBRL accounts.