The Tavi presentations at Data Amplified 2026 were really interesting and inspired me to have a play with it. I started reading the Tavi 1.0 Public Working Draft on the flight home, but to be honest I learn more from experiments and examples than from just reading. Existing Tavi examples and repos helped. I spent the next couple of weeks developing several proofs of concept (POCs) around Tavi. I'm sure I've made some incorrect assumptions and mistakes, so bear that in mind while reading or using Graffiti with Tavi. Any feedback or corrections would be welcome.
One way to use Tavi is to provide a document's XBRL data in a separate file, so I started by creating a Tavi JSON file for a PDF. Others demonstrated similar work at Data Amplified. Nothing here is groundbreaking, but I thought it would be useful to share the questions I had and the issues I hit, explain how my approach differs, and let others experiment with Tavi using Graffiti.
This post covers reading a PDF on its own, using machine learning (ML) to tag the facts, then viewing and exporting Tavi JSON. The PDFs were printed from Companies House iXBRL filings so I could check the tagging quality, but the iXBRL isn't used directly to create the Tavi JSON. In a later post I'll cover how I used iXBRL to create Tavi for an HTML5 report, similar to another demo at Data Amplified.
Tavi, a natural fit for Graffiti
Graffiti is a JavaScript tool that runs in the browser, and its architecture already works with JSON. It finds untagged figures in an iXBRL filing and has an ML model that checks whether facts have the right concept. Most of that carried over to PDFs and Tavi. I know the advice was not to develop software against the draft standard, but Graffiti's existing architecture made adding support for the Tavi draft "relatively" simple.
What it does
Open a PDF in Graffiti and ML tags the facts. Tagging an average PDF with a text layer takes about a second; scans take longer. Concepts come from the FRS 102 or IFRS taxonomy. Dimensions are FRS 102 only.
Graffiti does almost all its processing in the user's browser. I had avoided external libraries for security and performance reasons, but reading PDFs meant changing that policy. I now use PDF.js, Mozilla's PDF reader built into Firefox, and the open-source Tesseract OCR engine for scanned images. They both run in your browser. I host these libraries and pin them to fixed versions. Mozilla's PDF reader loads only when you open a PDF, and Tesseract only for a scanned page, so I think the security risk from these well-established, widely used libraries is very limited.
For ML, though, some data does leave the browser. Text such as row labels is sent to my API for tagging, along with each figure's order of magnitude (not its value). The PDF itself never leaves your browser.
After the facts are tagged, it's important for a human to review and edit the tags. Each tag is coloured by the model's confidence, so you can easily see which facts are most likely to need a fix.
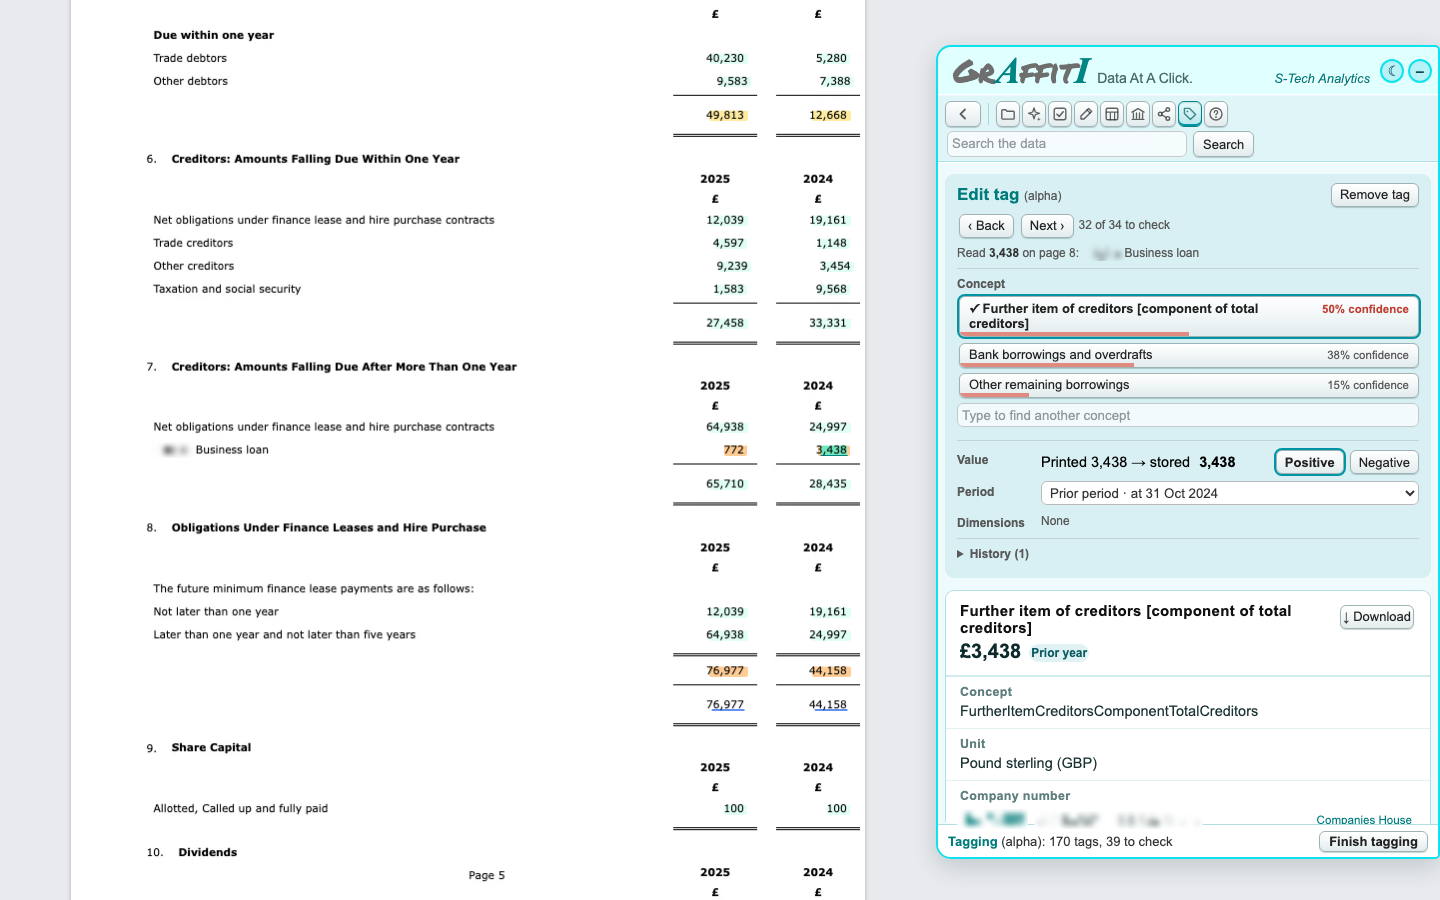
You can change any tag by choosing another of the model's suggestions or searching for a concept by name. You can also tag figures and text the model left untagged.
Note: although Graffiti could serve as a free tagger, this functionality is in alpha and currently intended for the POC and testing, not for producing official documents.
How well it does
I printed 50 recent Companies House iXBRL filings to PDF with Chromium, let Graffiti tag each PDF blind, then compared the results with the tags the companies filed. Graffiti found 96% of the companies' tagged figures that appeared in the PDFs; most misses were in the notes or were dashes. Of the figures it found, 96% got the same concept the company chose, and 74% matched every part of the tag (concept, period, dimensions, sign and scale).
I built the ML model to spot facts tagged with the wrong concept. It also worked well at choosing concepts for tagging. Many disagreements are not clear errors: sometimes both tags fit, with one more specific than the other (VAT payable versus other taxation). In other cases, both give the same value in these small companies' accounts but mean slightly different things (total additions versus additions other than through acquisitions). In a few cases, the filing's own tag looks wrong.
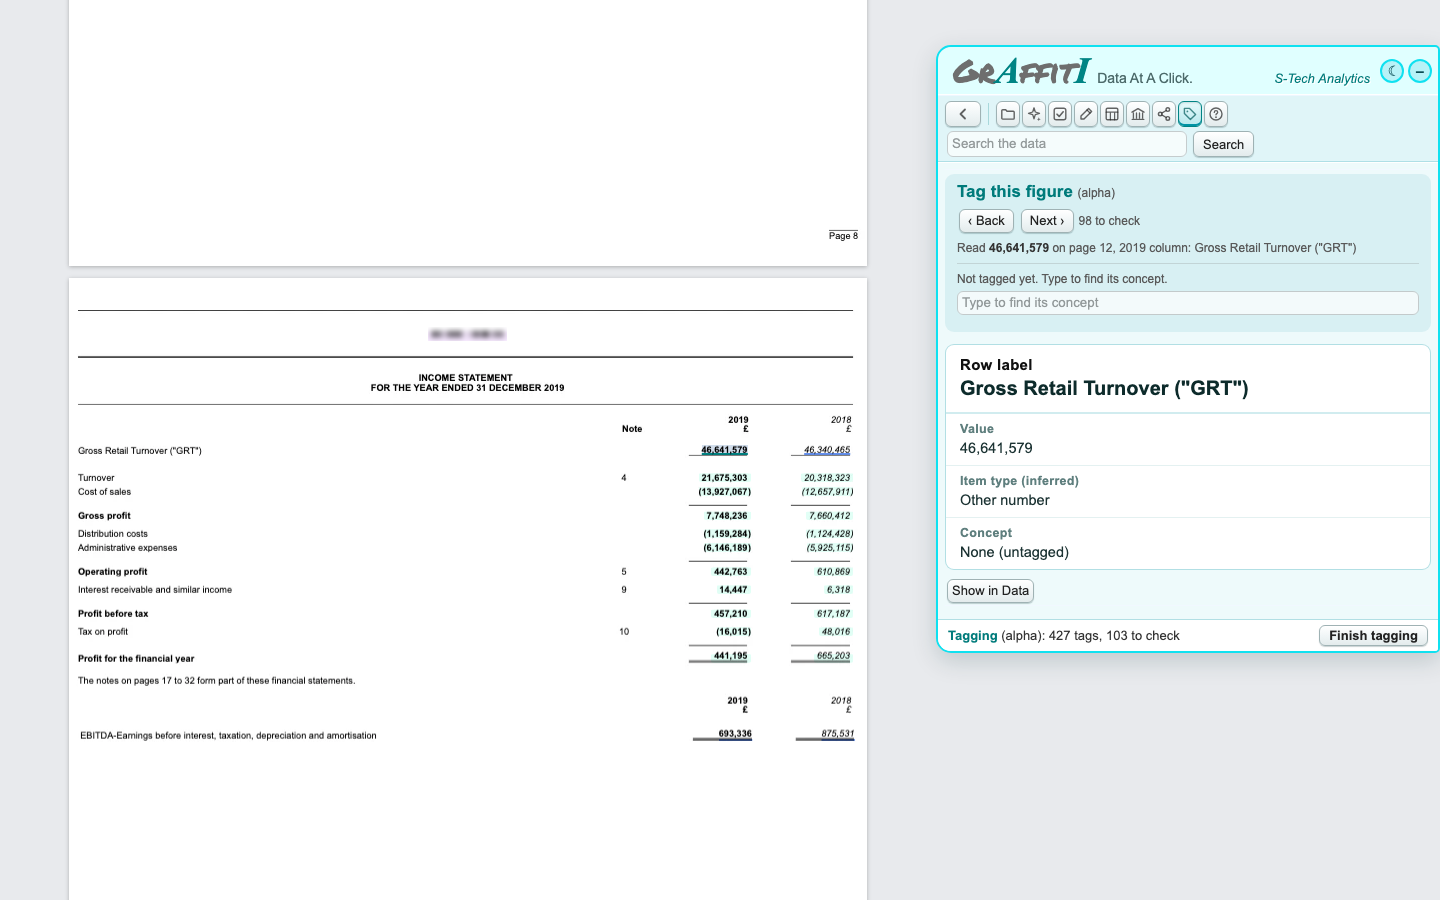
If no concept fits well, the model leaves the figure untagged. It also checks figures against each other. For example, the model thought Gross Retail Turnover ("GRT") was TurnoverRevenue, but the income statement's own turnover already gives that fact for the year, so GRT is left untagged. This helps prevent mistagging.
Dimensions are harder. To identify the class of fixed asset in a note, I replaced my first rules-based classification with a trained model that also reads the surrounding data. That took accuracy on the 50 test PDFs from 69% to 90%. The biggest remaining gap is knowing when to use current or within one year. Filers tag the same debtors and creditors lines with one, the other or both, depending on their software and on whether the line is on the balance sheet or in a note, so the page alone often can't settle it.
I'd be curious to see how other models and tools perform. The 50 PDFs, the filings as filed, Graffiti's tags and the comparison are in my Tavi testing repo, so anyone can make their own comparisons.
Saving it as Tavi
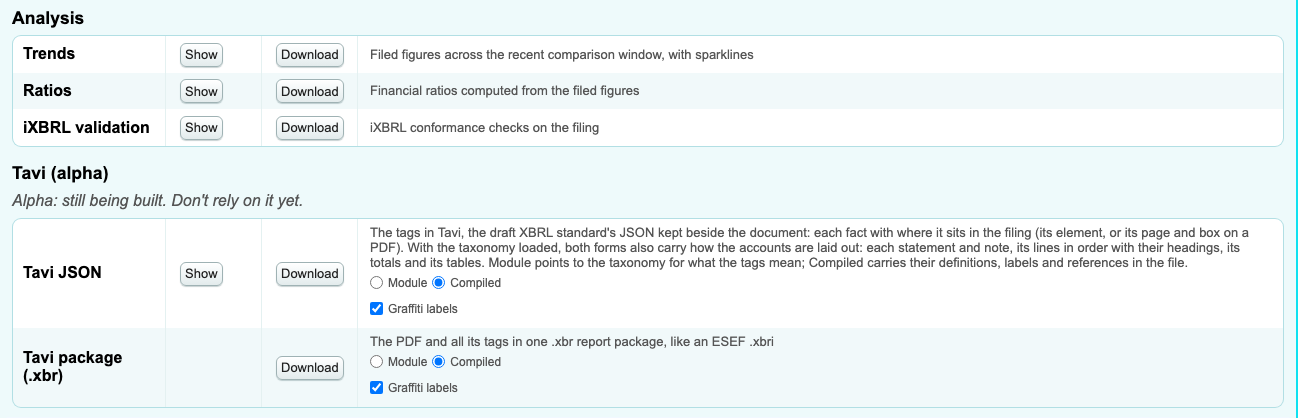
The Data tab lets you view and search the Tavi JSON, or download it as a Module or Compiled file. A Module holds the facts and imports the taxonomy from its published address. A Compiled file is “a single model where all objects are defined within a single model and no external modules or models are imported”: bigger, but any Tavi tool can open it on its own, so it is Graffiti's default.
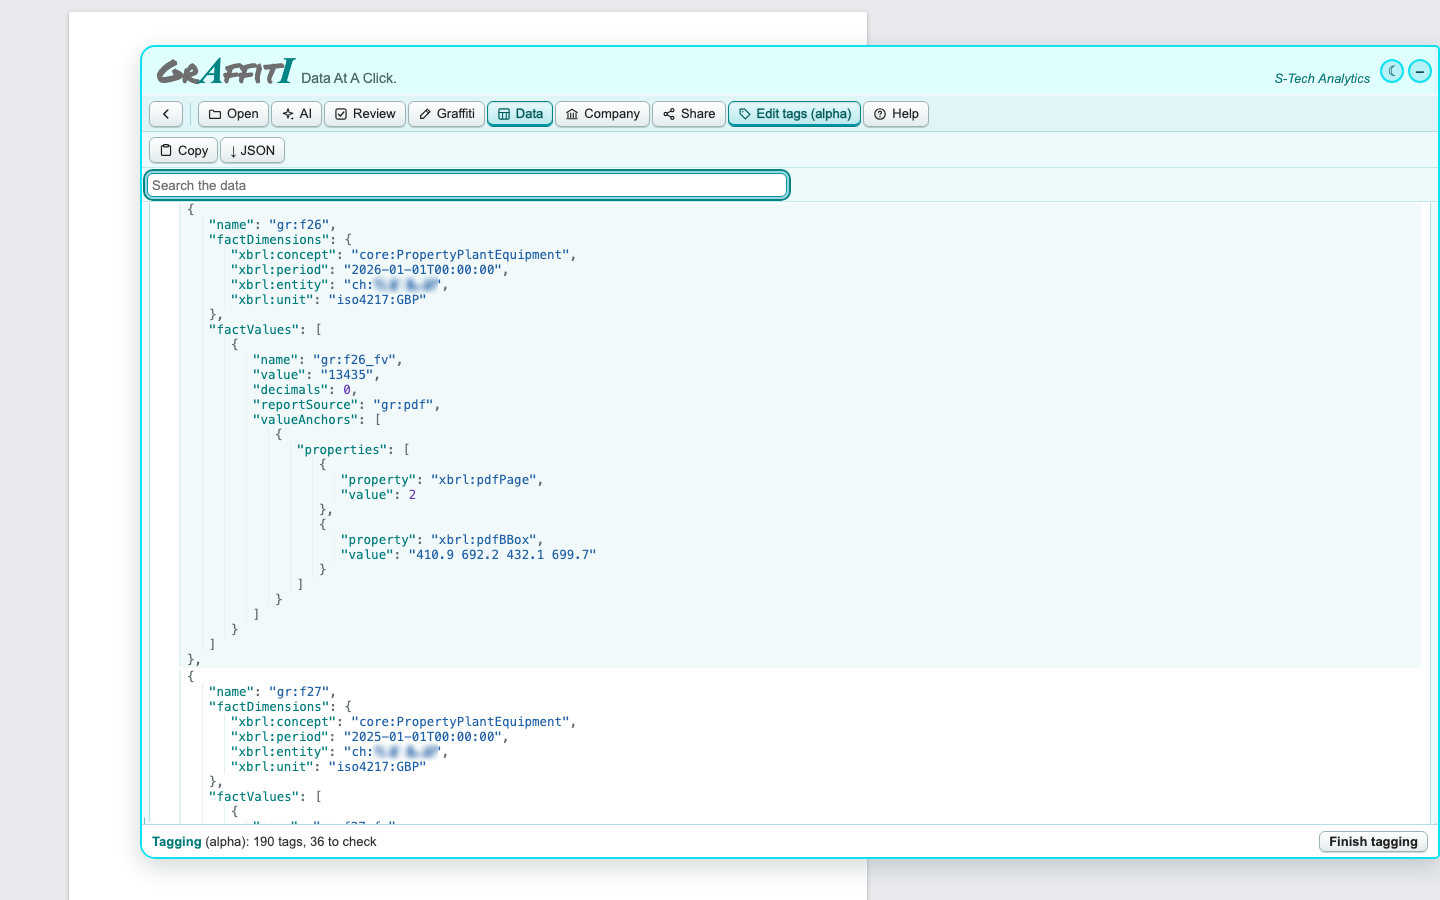
Pointing at the figures. Mozilla's PDF reader can't rewrite a PDF's page content, so Graffiti doesn't add marked content identifiers (MCIDs). Instead, the Tavi file points to each figure by page and box. This works well on PDFs with a text layer, but on scanned pages read by OCR I found the boxes could sit slightly off, perhaps because of a bug in my code. If you produce the PDF yourself, MCIDs are probably the more reliable anchor. If the PDF has no MCIDs and is already signed, or must stay untouched for provenance reasons, boxes might be the better option.
Packaging was the part I was least sure about. The JSON on its own refers to the PDF by its file name, as a relative link. I also experimented with a Tavi package that puts the PDF and JSON together in one report package (.xbr). Should they travel together in a zip, or should the JSON stay separate, linking to the PDF by a relative or absolute path? Linking to an online PDF lets a tool open it from the JSON. With both files on my own machine, another tool loaded the PDF automatically when I opened just the JSON. Graffiti runs in the browser, so it can't open a file you haven't chosen: open the JSON on its own and you see the JSON without the PDF. In Graffiti, you need to open the PDF and the Tavi JSON together to show the tags over the PDF.
As a third option, someone tagging their own PDF might be able to attach the Tavi JSON inside it. I haven't tried that yet. I'd be interested to hear what people think or expect.
I checked Graffiti's Tavi output in an existing Tavi prototype viewer and validator. The Compiled files loaded, and once I had fixed a bug in Graffiti they validated without errors. The Module files, which import the taxonomy, gave some errors, but I believe they come from the taxonomy and non-standard symbols rather than from Graffiti's Tavi output.
A caveat
This was an odd proof of concept for me. I'm wary of starting from a PDF because it doesn't contain all the data needed to tag the items properly. Filers often need information that's not in the PDF to tag dimensions, and no model can predict what isn't there. Still, it was cool to open a PDF and have 427 facts tagged and saved as Tavi in a few seconds, with most of that time spent moving the mouse and making two clicks. Of course, properly checking the tags and fixing dimensions takes longer.
How to try it
While this feature is in alpha, PDF tagging is free to use. To see it without downloading anything, open PDF accounts in Graffiti: Graffiti tags the PDF as it opens. To try your own, open a PDF in Graffiti: on the website's Browse page, choose "Your own file or link". If you already have Graffiti open on a filing, click Open, then Choose files. Then use the Data tab to view, search or export the Tavi JSON. The Share button downloads the PDF and its tags together as a .xbr (zip) package, or the document and its tags as an Inline XBRL file if you want a more familiar reference.
Happy for any corrections or comments.
Jesse Karadia
S-Tech Analytics
stechanalytics.com